
Searches for a profitable crash game strategy usually lead to low-multiplier systems, Martingale progressions, pattern tracking, signal bots or claims of a “safe” auto-cashout. These methods can change how a session feels, but they do not remove the underlying house edge. A useful strategy guide therefore needs to separate four questions: what controls expected value, what controls variance, how staking changes bankroll pressure, and which claims are mathematically false. Exact probability and session calculations belong in the Crash Game Calculator; this page explains how to use those numbers when setting rules.
What a Crash Strategy Can and Cannot Change
| Decision | Can change | Cannot change by itself |
|---|---|---|
| Cashout target | Win frequency, payout size and variance | Base house edge under the standard model |
| Auto-cashout | Execution consistency and reaction risk | Probability that the multiplier is reached |
| Flat or percentage staking | Turnover speed and bankroll exposure | Expected return per unit wagered |
| Martingale or other progression | Distribution and tail risk | Negative expected value |
| Stop-loss or time limit | Total number of bets and maximum planned exposure | Expected value of each individual round |
| Pattern tracking | How past results are displayed | The next hidden independent result |
The Standard Model and Expected Value
 For the standard continuous crash model: P(reach X) ≈ RTP ÷ cashout multiplier Expected value for a fixed stake is: EV = P(win) × profit if win − P(loss) × stake At 97% RTP, a one-unit bet has an expected result of approximately −0.03 units. The cashout target changes how that result is distributed, but not the standard-model average:
| Cashout target | Approx. reach probability | Profit on a one-unit win | Expected P/L per bet |
|---|---|---|---|
| 1.50x | 64.67% | +0.50 units | −0.03 units |
| 2.00x | 48.50% | +1.00 unit | −0.03 units |
| 5.00x | 19.40% | +4.00 units | −0.03 units |
| 10.00x | 9.70% | +9.00 units | −0.03 units |
Cashout Target: Frequency vs Variance
A lower target normally creates more winning rounds and smaller wins. A higher target creates fewer wins and larger payouts. The practical trade-off is variance, not a change in base EV.
Lower target
- higher hit frequency;
- smaller profit per win;
- lower per-round variance in the standard model;
- still vulnerable to damaging loss runs when stakes are oversized.
Higher target
- lower hit frequency;
- larger profit per win;
- longer dry spells;
- greater dependence on rare outcomes during short sessions.
The updated Crash Game Calculator shows exact fixed-stake session distributions, so there is no need to infer risk from an average alone.
What Auto-Cashout Actually Changes
Auto-cashout is an execution tool. It applies a selected exit point consistently without waiting for a manual click. It can:
- reduce hesitation and late manual cashouts;
- prevent emotional target changes during a round;
- make the same rule reproducible across a session;
- reduce interface and reaction-time errors.
It cannot:
- increase the probability that the game reaches the target;
- change the published RTP;
- prevent an instant crash below the selected point;
- turn a low target into a risk-free strategy;
- detect patterns in the next hidden result.
For numerical comparisons between targets, use the Crash Auto-Cashout Optimizer.
Flat Stakes, Percentage Stakes and Progressions
| Method | What it changes | Main limitation or risk |
|---|---|---|
| Flat stake | Keeps turnover and exposure easy to track | Bankroll still declines in expectation when EV is negative |
| Percentage stake | Automatically reduces stake after losses and increases it after gains | Does not create an edge; long sessions still expose more volume |
| Martingale | Creates many small recoveries and rare very large stakes | Exponential tail risk and platform limits |
| Anti-Martingale | Increases exposure during winning sequences | Can return accumulated profit quickly when the next round loses |
| Unstructured loss chasing | Raises turnover after emotional pressure | No defined risk ceiling and the greatest execution instability |
Flat staking is not profitable by itself, but it makes the cost of a strategy easier to audit. Progressions obscure the same negative expectation behind a more extreme result distribution.
Why Martingale Fails
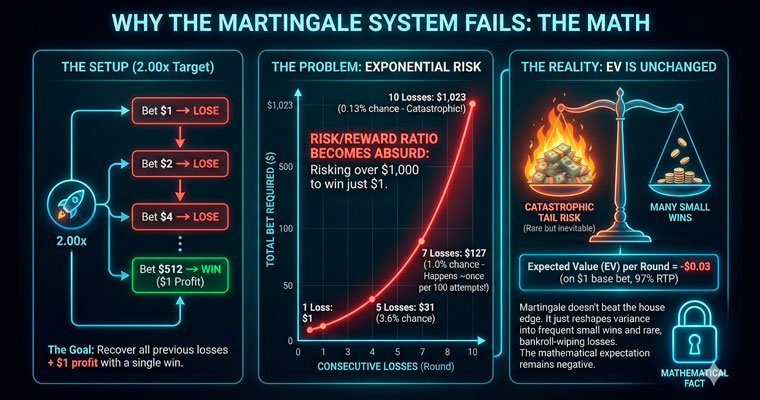 At a 2.00x target, a classic Martingale doubles after each loss:
| Losses in a row | Next bet | Accumulated losses | Net profit if next bet wins at 2.00x |
|---|---|---|---|
| 3 | 8 base units | 7 base units | 1 base unit |
| 5 | 32 base units | 31 base units | 1 base unit |
| 7 | 128 base units | 127 base units | 1 base unit |
| 10 | 1,024 base units | 1,023 base units | 1 base unit |
Below 2.00x, simple doubling does not fully recover the sequence because the profit on a winning bet is smaller than the stake. The general recovery formula is: Required next stake = (accumulated losses + desired profit) ÷ (multiplier − 1) Martingale does not improve EV. It exchanges frequent small recoveries for a low-frequency failure that can exceed the bankroll or maximum allowed bet.
Some games allow two simultaneous bets on the same crash point. These bets are highly correlated because both depend on one result. Consider one total unit split as follows:
- 0.70 units at 1.50x;
- 0.30 units at 5.00x;
- 97% RTP standard model.
The round has three relevant regions:
| Crash result | Probability | Net result on the combined one-unit wager |
|---|---|---|
| Below 1.50x | 35.33% | −1.00 unit |
| 1.50x to below 5.00x | 45.27% | +0.05 units |
| 5.00x or higher | 19.40% | +1.55 units |
EV = 35.33% × (−1.00) + 45.27% × 0.05 + 19.40% × 1.55 = −0.03 units The structure produces a small positive result in the middle region and a larger result above 5.00x. It changes the distribution, but it is not an independent hedge and does not improve the 97% RTP expectation.
Stop-Loss, Stop-Win and Time Limits
Session limits do not improve the EV of an individual round. They control how many rounds are played and therefore how much total volume is exposed to the house edge.
Stop-loss
Ends the session at a pre-defined loss. It limits planned downside for that session but cannot guarantee the limit is never exceeded if a bet is already active.
Stop-win
Ends the session after reaching a profit target. It preserves a realized session result by stopping further exposure; it does not make earlier bets more favorable.
Time or round limit
Caps turnover. Since expected loss scales with total wagered volume, fewer rounds reduce the amount exposed during that session.
Pre-commitment
Rules should be set before play. A limit repeatedly moved after losses is not functioning as a limit.
Bankroll Risk Without a Universal Safe Percentage
There is no universally safe bankroll percentage in a negative-EV game. A suitable entertainment stake depends on:
- cashout target and hit frequency;
- planned number of rounds;
- session loss limit;
- available bankroll;
- acceptable probability of ending the session at a loss;
- platform minimums and maximums.
A fixed percentage such as “always bet 1%” is not a mathematical guarantee. The relevant question is whether the selected flat stake allows the pre-set loss limit to absorb an ordinary losing run at that target. For quantified session and streak probabilities, use the Crash Game Calculator. For a separate bankroll model, use the Risk of Ruin Calculator.
Why Previous Multipliers Do Not Predict the Next Round
Historical charts make random sequences look structured because streaks, clusters and gaps naturally occur. A run of low multipliers does not make a high result due. A recent 100x does not make another high result impossible. In an independent properly implemented system, the next hidden outcome is not altered by visual patterns in earlier rounds. Pattern-based systems usually fail for three reasons:
- gambler's fallacy: treating independent outcomes as self-correcting in the short run;
- selection bias: remembering patterns that appeared to work and ignoring failures;
- overfitting: designing a rule around historical noise and assuming it will persist.
A predictor claim should be evaluated on a locked, out-of-sample test with every prediction recorded before the outcome. Screenshots and selected winning signals are not evidence.
Within the Standard Model, RTP Controls Base EV
In the model used throughout this guide, expected loss per unit wagered equals the house edge:
| RTP | House edge | Expected loss per 1,000 units wagered | Approx. chance to reach 2.00x |
|---|---|---|---|
| 99% | 1% | 10 units | 49.50% |
| 97% | 3% | 30 units | 48.50% |
| 96% | 4% | 40 units | 48.00% |
| 95.5% | 4.5% | 45 units | 47.75% |
Provider rules, bonuses, cashback, fees, multiplier caps and non-standard probability mechanics can alter effective return. Always check the exact game version rather than assigning one RTP to an entire platform.
A Practical Decision Framework
Find the exact RTP, instant-crash condition, multiplier cap and settlement rules.
Select a target based on hit frequency and drawdown tolerance, not a belief that it improves EV.
Flat staking or a pre-defined percentage is easier to evaluate than emotional progression.
Define maximum loss, time and round count before the session begins.
Use the session and streak tools rather than relying on average outcomes alone.
Past multipliers and public screenshots do not reveal the next hidden result.
Frequently Asked Questions
What is the best crash game cashout multiplier?
Does auto-cashout improve crash game odds?
Does Martingale work in crash games?
Is cashing out at 1.01x safe?
Do stop-loss and stop-win rules beat the house edge?
Is there a safe percentage of bankroll to bet per round?
Can previous crash multipliers reveal a pattern?
Does a dual-bet strategy improve expected value?
What variable matters most for long-run expected loss?
Summary: What the Math Supports
- RTP controls base EV in the standard model. Cashout target changes frequency and variance.
- Auto-cashout improves consistency, not odds.
- Progressions reshape risk. They do not remove negative expectation.
- Dual bets are correlated. They create more outcome regions, not an independent hedge.
- Session limits control exposure. They do not make each bet favorable.
- Past patterns do not predict the next hidden round.
- Bankroll rules must be tied to a defined session and loss tolerance.
Responsible gambling notice: no crash game strategy guarantees profit. Probability and bankroll tools explain risk but do not remove the house edge. Set strict limits, avoid chasing losses and never wager more than you can afford to lose.